22 Apr Ed Talks: Excel Power Query
By: Ed Jaworski
In this edition of Ed Talks, we will explore the Power of Excel Power Query. Let’s face it: us accountants are number geeks…we love numbers! Power Query is a data analysis tool built into MS 365 versions of Excel and other data analysis tools (like Power BI). Technically, Power Query simplifies data acquisition and transformation. It’s like having a supercharged data wrangling assistant right there in Excel or Power BI. With Power Query, we can effortlessly transform, clean, and reshape data from various sources, unleashing the full potential of our number-crunching skills. Whether it’s merging multiple datasets, filtering rows, or pivoting columns, Power Query streamlines the process and lets us focus on what we love most: diving deep into the numbers to uncover insights and drive informed decisions. Plus, its intuitive interface makes it accessible even for those who might not consider themselves Excel wizards. It’s definitely a game-changer for data analysis aficionados like us!
What do you mean by “data acquisition”? Power Query makes it easy to retrieve data from multiple sources, such as a range or table in your current spreadsheet, another Excel spreadsheet, a CSV file, all the files in a folder, etc. No matter where the data source is, once it has been pulled into your query you are working with a consistent user interface.
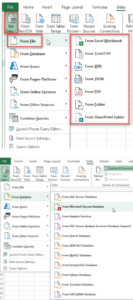
Start by clicking the Data tab in Excel:

You can see some of the versatile, built in data sources from the “Get Data” drop down menu:

What do you mean by “data transformation”? If you want to use the Excel tools to analyze data, the data needs to be arranged in a contiguous range or table (no blank rows or columns). Power Query is an excellent tool to arrange an Excel file in report format to a data table. Transformation tools are also used to “shape” the data into a usable format for further analysis.
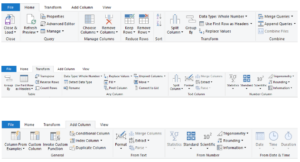
Once the data is loaded, you are presented with the transformation tools:

Common transformations:
- Remove unneeded rows or columns
- Filter or sort data
- Control the data type (text, number, date, etc.) for each column
- Merge or Append data from multiple sources. The merge function is easier to work with and more powerful than the familiar VLookup function.
- Pivot or Unpivot data groups
- Add new columns depending on conditions or to apply a formula (existing data plus 10%, for example).
- Split text data based on a delimiter, such as separating a parent item and a sub-item into two existing columns based on the colon delimiter.
- Aggregate (group) data
- Combine multiple files that have the same data structure in the same folder into one data set. Great for trend analysis, such as seeing how the net customer balance changes over time
Tip: If the data analysis you are doing is a one-time operation, use the Get Data from a Range option and keep everything in one workbook. If you expect to repeat the same steps in future months, use the Get Data from a File (Excel or CSV). With this approach, you only need to recreate/update the source file and then hit Refresh in your Power Query file to repeat the acquisition and transformation steps with new data.
Some of the things you can do. Some of the tasks that Power Query can be used for:
- Prepare data obtained from website sales to be imported into QuickBooks Sales Receipts
- Apply a standard rate from a price list table to items from a sales report
- Transform data exported from a QuickBooks desktop file to prepare for a migration to QBO
- Shape data to a form that can be analyzed with standard Excel pivot tables
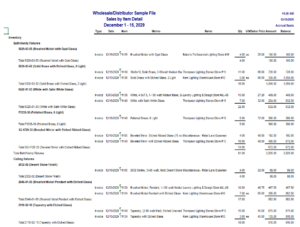
Turn a report like this:

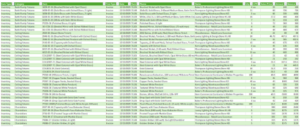
Into a data table like this with just a few clicks:

Once the data has been transformed into a table, then creating a pivot table to analyze it is a snap. Give it a try. In no time at all you will see how Power Query radically simplifies the review and analysis of data!


