

23 May Top 5 Numbers Every Business Owner Needs to Track in 2025
The Numbers That Keep You in the Driver’s Seat
Running a business in 2025 means making more decisions, faster, and often with higher stakes. Whether you’re navigating labor shortages, adjusting to AI automation, or managing through supply chain volatility, one thing remains constant: your numbers hold the truth.
But here’s the challenge: too many business owners only look at revenue or their bank balance. That’s like driving with one eye closed. To truly lead your business forward—whether it’s a construction firm, fitness center, software company, or nonprofit—you need to look at the right combination of performance indicators.
These five numbers aren’t just financial metrics, they’re strategic signposts. They help you stay proactive, not reactive. They identify strengths you can scale and weaknesses you can address early, before they become costly.
Let’s explore the top 5 numbers every business owner needs to track in 2025, including what they mean, how to calculate them, what healthy benchmarks look like by industry, and how to use them to guide real business decisions.
Gross Profit Margin: Your First Look at Profitability
What It Is:
Gross Profit Margin (GPM) tells you how much of your revenue is left after covering the direct costs of delivering your product or service—also known as Cost of Goods Sold (COGS) or Cost of Sales.
Formula:
(Revenue – Cost of Goods Sold) ÷ Revenue
Why It Matters:
This margin is the first stop in understanding profitability. It shows how efficiently you’re producing or delivering what you sell. A low margin could mean pricing issues, rising costs, or even an unprofitable product mix.
If your GPM is shrinking, it’s a red flag—especially in an inflationary year. You may be underpricing or absorbing supplier cost increases without passing them on.
Healthy Gross Profit Margin Targets:
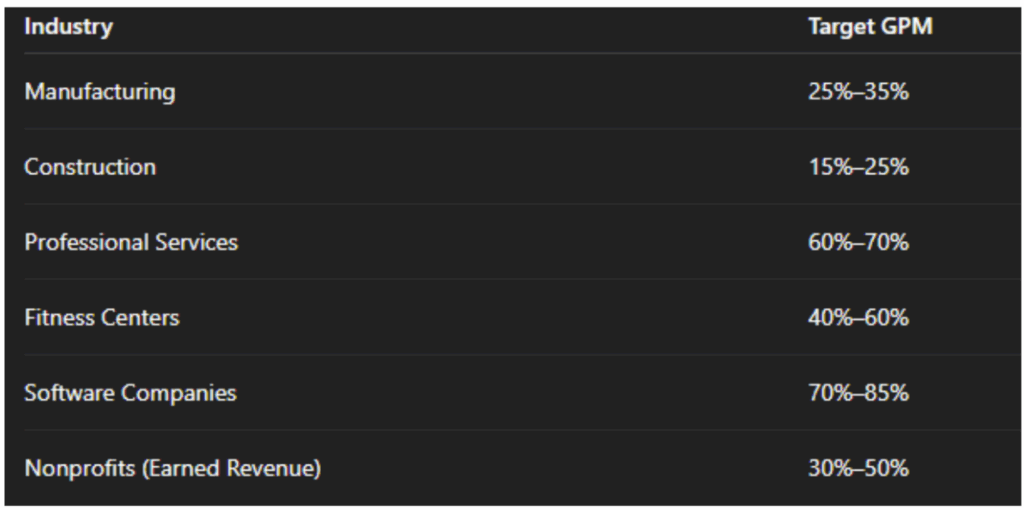
💡 Actionable Tip:
If your margins are tight, conduct a cost audit every quarter. Look at material prices, contractor fees, packaging, delivery costs, and vendor discounts. Can you renegotiate? Can you automate? Can you productize a high-margin service?
Net Operating Income (NOI): Profit From Your Day-to-Day Operations
What It Is:
Net Operating Income shows what’s left after paying your operating expenses—before taxes, interest, or one-off items.
Formula:
Gross Profit – Operating Expenses
Why It Matters:
Your NOI is the heartbeat of your operational efficiency. It shows whether your business model works. It answers the question: “If we stripped away all the outside noise—just looked at our core operations, are we truly profitable?”
This is especially important in 2025, as wages rise, subscription software costs pile up, and outsourced services become the norm.
Healthy NOI Targets:
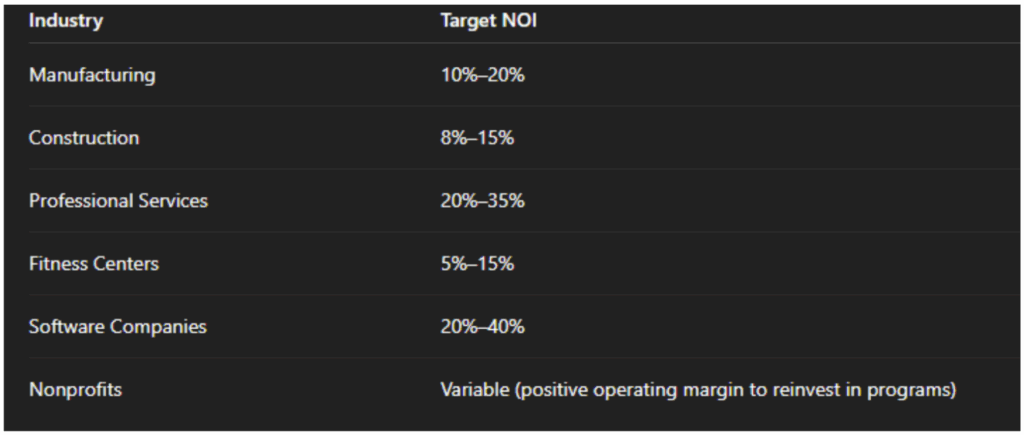
💡 Actionable Tip:
Build a monthly budget-to-actual report. Categorize expenses into “essential,” “growth,” and “optional.” Review your “optional” spend quarterly and cut anything not driving clear ROI.
Cash Flow from Operations: Profit May Be an Opinion, But Cash Is Fact
What It Is:
This number tells you how much cash your core operations are actually generating. It adjusts for non-cash items and working capital shifts—giving you the clearest view of whether your business runs on positive cash flow.
Why It Matters:
A profitable business can still run out of money. We’ve seen it time and again—especially in seasonal businesses or those with long accounts receivable cycles. Cash flow from operations shows how sustainable your business is day-to-day.
Healthy Target Ranges (Positive Operating Cash Flow as % of Revenue):
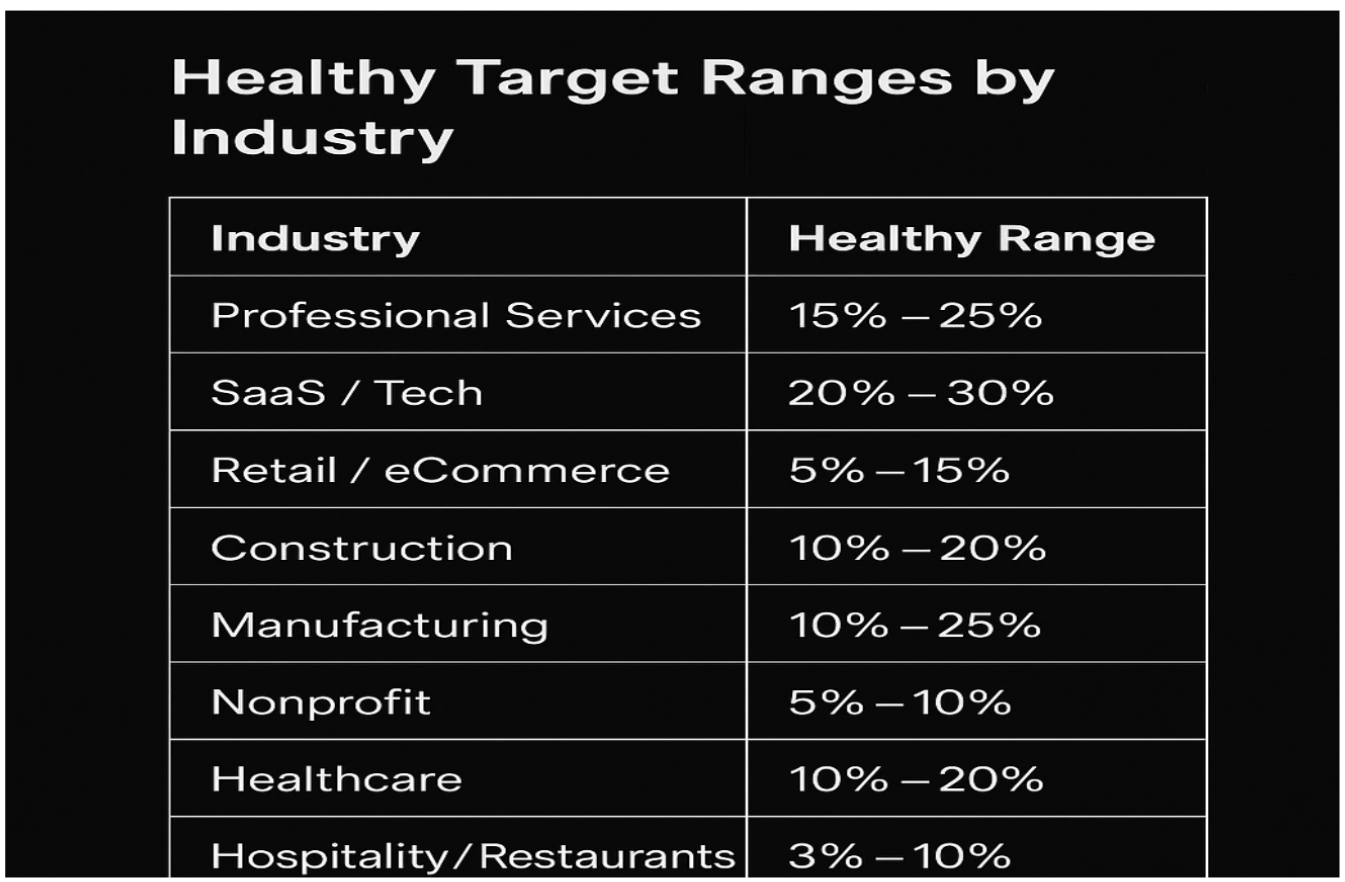
💡 Actionable Tip:
Implement weekly cash tracking. Monitor when receivables are due, vendor payments hit, and payroll runs. Set a cash threshold (e.g., 3x monthly expenses) as your internal “cash buffer.”
Accounts Receivable Turnover: Get Paid Faster, Grow Smarter
What It Is:
This measures how quickly you collect customer payments—showing how many times per year you convert receivables into cash.
Formula:
Net Credit Sales ÷ Average Accounts Receivable
Why It Matters:
Slow collections limit your ability to reinvest in growth. And with borrowing costs higher in 2025, financing your business off customer IOUs is riskier than ever.
If your A/R turnover is low (or your DSO is too high), you’re essentially a bank for your clients—and that’s not your job.
Healthy A/R Turnover Benchmarks:
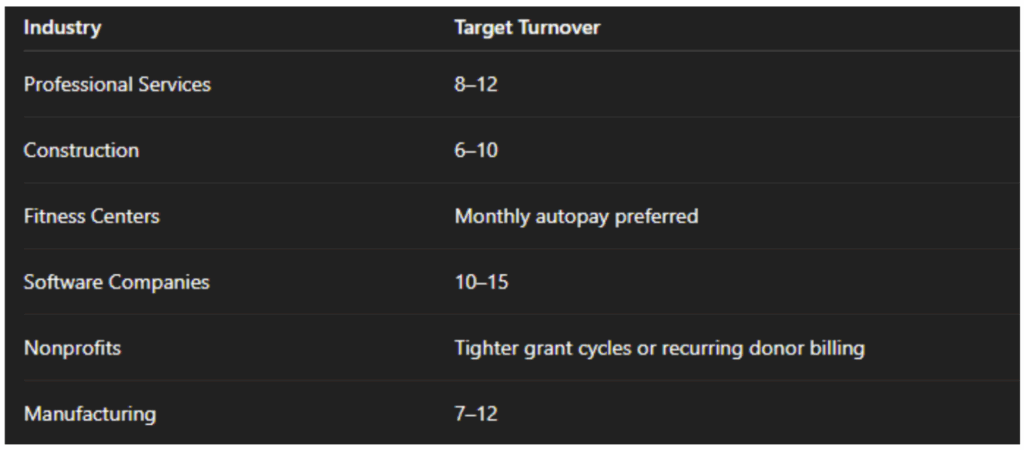
💡 Actionable Tip:
If you’re struggling to collect, automate reminders, and incentivize early payment (e.g., 2% discount if paid in 10 days). Also, review contracts—are your terms clear and enforceable?
Net Income: What You’re Really Keeping
What It Is:
Net Income is your bottom-line profit after everything—costs, operating expenses, interest, taxes, and depreciation.
Why It Matters:
It’s tempting to celebrate top-line growth, but net income is what pays off debt, funds expansion, and builds owner equity.
In 2025, this number is especially critical as many business owners are preparing for exit planning, refinancing, or investor conversations.
Target Net Income by Industry:
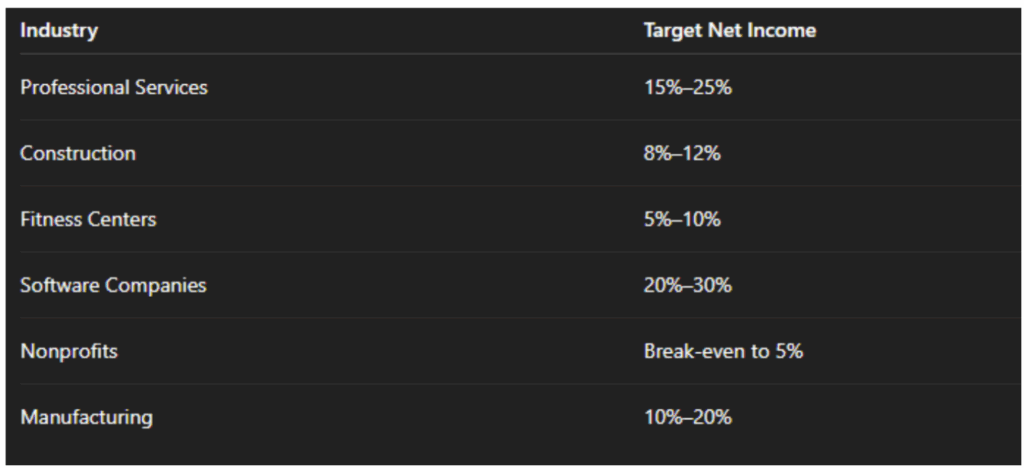
💡 Actionable Tip:
Look beyond just the bottom number—calculate your Net Income Margin (% of revenue). This helps you compare profitability across time and between service lines.
These five numbers—Gross Profit Margin, Net Operating Income, Cash Flow from Operations, Accounts Receivable Turnover, and Net Income—are the dashboard of your business.
Together, they give you a 360° view of:
– How efficiently you operate
– How reliably you get paid
– How much cash you can reinvest
– Whether your pricing, cost control, and customer relationships are healthy
And most importantly, they give you the confidence to make decisions—not just based on gut feel, but grounded in data.
In 2025, make it a priority to review these metrics monthly. Share them with your leadership team. Build a rhythm around financial review and planning.
Because here’s the truth: Businesses don’t fail from lack of passion—they fail from lack of financial visibility. When you know your numbers, you take control of your future. Contact us for support.