10 Jun Generating Professional Reports with QuickBooks
You probably already run reports in QuickBooks – but are you making full use of the program’s reporting tools?
Let’s take a look. Reporting changed a lot between QuickBooks 2009 and 2010 in terms of interface, navigation, and access to reports. We’ll look at version 2010 since the core reporting mechanisms are similar, and wrap up with a brief summary of the new features in 2010.
Extensive Customization
Open the Reports menu. You can go directly to the Report Center, but since the interfaces are different (and very self-explanatory), we’ll work from the menu.
Drop down to Sales, and in the pop-out menu, click Sales by Customer Detail. You’ll see a window similar to Figure 1.

Figure 1: You may just be changing the date range when you run reports in QuickBooks. If so, you’re missing out on a lot of customization and other features.
Don’t like displaying the date/time/basis for each report? Click Hide Header and then Show Header if you want to bring it back.
Is the text in some of your columns – usually Name, Item, and Memo – being truncated (such as “Gutter clean…” in the example above)? Grab the diamond to the right of the column name and drag it to the right with your mouse. It may take some adjusting to make every column header display properly.
Are you exporting a lot of reports to Excel workbooks but never clicking on the Advanced tab in the dialog box? If your reports always look different in Excel and you don’t like them, it may be because you’re skipping this step. Click the Export button, and the dialog box shown in Figure 2 appears. Click Advanced to see this view.

Figure 2: Before you export a report to an Excel worksheet, click the Advanced tab in the Export Report dialog box. You’ll be able to select options that will preserve or ignore the original QuickBooks formatting.
Sophisticated Modifications
To get to the real meat of your modifications, click the Modify Report button. You’ll be able to tinker with a number of report elements here, including (and shown in Figure 3):
- Display. What dates should the report cover? Which columns should display? (You’ll have plenty to choose from.) Cash or accrual? How do you want to total and sort data? Click Advanced to show all accounts or those in use during the report period, and to display a customer’s current balance or the balance as of the report’s ending date.
- Filters. QuickBooks builds in powerful filtering capabilities, allowing you to corral a subset of data that contains exactly what you want, down to the words included in the Memo field. Take some time here and read the accompanying help files. A box on the right displays the current filters; you can easily remove any of them or revert to the original configuration.
- Header/footer. Easy stuff. How should the report look? QuickBooks gives you a lot of control over that. You’ll simply check or uncheck boxes, and enter information.
- Fonts & Numbers. Easy there, too. You can make choices about the fonts and colors you want your report to contain, and how you want numbers to be displayed.

Figure 3: QuickBooks gives you an enormous amount of control over the format and content of your reports.
Memorization and More
Once you’ve gone through all the trouble of formatting a report, you’ll probably want to save it so you can use it again (the settings are memorized, not the data). QuickBooks makes this easy. With the report open, click Memorize. In the window that opens, type a name for your report (if you want to specify a new one), and check the box next to Save in Memorized Report Group if you want it categorized. To access a memorized report, open the Reports menu and put your mouse on Memorized Reports. From the pop-out menu, select the report you want. You’ll still be able to modify it.
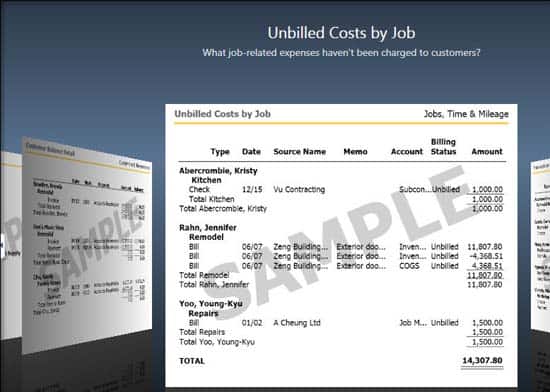
The new Report Center in QuickBooks 2010, shown in Figure 4, makes it easier to locate the desired reports quickly. It features a scrolling 3D representation of sample reports in each financial category (list and grid views are also available); you can click on icons in a toolbar to see your own version of the report, change the dates, learn more about it, and tag it as a favorite. Other links let you toggle the view among standard, memorized, favorite, and recently accessed reports.

Figure 4: This “carousel” view of sample reports in QuickBooks 2010 especially helps beginners find the correct report. Grid and list views are also available, as are other tools for locating the right screen.
When you’re just running reports for your own edification, you may not do more than select a report and change the date range. But there will likely be many occasions when you’re presenting reports to an audience, like bankers or potential customers. QuickBooks’s report tools can help you slice and dice your data in myriad ways and make your financials look polished and professional. The ability to export to Excel opens up even more possibilities.
If you need help with this feature, or you have any questions about QuickBooks, don’t hesitate to give us a call.


